How to Write an Infographic Brief
1. Explain the Purpose and the Audience
Start your brief by describing the topic or concept of your infographic and the audience you’re trying to reach. This will help the designer understand what the infographic will be about, who it is intended for. It’s almost impossible to come up with a great design when the purpose of the project isn’t clear.
2. Clearly establish the Subject of the Infographic
Providing a little explanation (just 1 or 2 paragraphs) about the infographic can be enough here. You can also include any additional materials that will help the designer understand the subject: videos, presentations, articles, etc. More attention should be paid to this point if the infographic describes a complicated device or more abstract concept.
3. Know your Audience
The audience you’re trying to reach will greatly influence the look and feel of the infographic, including the style, colours, and illustrations. If the designer understands who the audience is, they can come up with a design that best suits the project and the audience.
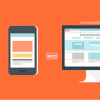
4. Determine the Deliverable: Size, Orientation, and Format (print or web)
It’s important to establish a few basic design parameters at the beginning of the project. First, how will people be viewing the infographic: printed, online, or both? This will directly affect both the size and orientation of the graphic, which will then dictate the design and layout.
For the internet
As a rule, the best width is 600-900 pixels and no more than 1,000 pixels to make it fit laptops and tablets. The width is the most important dimension because the infographic will be posted online.
The length can be up to 5,000 pixels, but it’s better to keep it to 2,000-2,200 pixels. Most sites and services (for example, Pinterest) correctly display long infographics, so the length is less important than the width dimension. In most cases, vertical orientation (portrait) is much more convenient for users. Horizontal orientation (landscape) is often used to display a timeline or a process.
For Print
If an infographic is created for print, you should specify this before the creative process starts as image resolution for print is much higher than for the web. If you print a web graphic, the imagery often looks fuzzy or pixelated. The size will be determined by a standard paper size (A1, A2, A3 etc), or can be bespoke poster size (50cmx70cm, 40cmx50cm etc). Bear in mind that an infographic that was originally prepared for the web is quite difficult to recreate for print and vice versa. By the way, for print versions of infographics, horizontal orientation (landscape) is more widely used.
For print and web
If a client wants to make an infographic for the web and print simultaneously, we proceed as follows: Divide the infographic into several parts; each part is perfectly placed on a standard A4 sheet. Make the design of every part according to the layout requirements (as it will be printed).
Combine all the parts into one infographic for web layout and for print layout.
As a result, the client receives two infographics: one for print and one for web. The print version may be used for printing on a standard printer. This is a good idea if, for example, the infographic has some tricks the user will want to use every day at work. It will be more convenient to print it than to open it up every time on a computer.
5. Brand Guidelines
Make sure you include brand guidelines and any assets the designer might need, such as the company logo, font files, and illustrations. Ideally, the logo and illustrations should be in vector format which are scalable to fit the design. If there’s a colour palette that should be used in the infographic, be sure to share it with the designer. If there are no special requirements, it’s possible to provide colour suggestions based on your industry or the topic. This will help the designer to better understand the project and create a great infographic that matches your expectation.
6. Design Ideas
Clients often have ideas of how they’d like the infographic to look. If you have something in mind, share your ideas or sketches with the designer. It’s very helpful to show examples of infographics you like. The examples can show a colour palette, type treatment, or concept you like. Sharing examples helps avoid misunderstandings and make the design process smoother. You can also include:
Description of the setting. If you have a clear idea of where the characters should be located, then make sure to provide a detailed description of the situations. For example, the main character should be sitting on a couch in a living room watching TV with a tablet in their hands.
Products, screenshots, etc. Often infographics are devoted to products or services. If that’s the case, it’s necessary to specify which products or product features will be highlighted. Ideally the client would provide high-quality screenshots or imagery of a service or software or provide the designer with access to produce their own.
Charts. Often various charts and graphs, as well as combined graphics, are used in infographics. If you know what kind of data will be used for different types of graphs, then this should be indicated in the creative brief. It’s most helpful if the designer has a high-level summary of the data points as well as the source data in case a graph needs to be rebuilt or reformatted. For example, the designer might find that a bar graph is a more effective way to communicate the data than the pie chart that was supplied.
Also, keep in mind that the user is interested in the conclusions that can be drawn from the data. Therefore, all graphics should be accompanied by a brief summary. These should also be given to the designer so they can present not only the charts but also the notes and explanations that go with the charts.
Fonts. If there’s a specific set of fonts the designer should use, you should specify this in the creative brief and also provide the font files.
7. Text & Copy
The text is a very important part of the design process and directly affects the size and design of the infographic, the location of elements, and the layout. Be sure to share the final version of the text with the designer in an editable format. Make sure the text is clearly structured, short and consistent.
It’s a good idea for the client and designer to have a kick-off meeting and discuss the creative brief. You can go over the style, examples, brand guidelines, and clarify what the text means, what’s important to communicate, and what you want the target audience to take away from it.
Let us know what you think — contact us here.